Data Analytics Bootcamp
Syllabus
Statistical Thinking
SQL
Python
Tableau
Lab
Capstone
Python
Syllabus
Statistical Thinking
Statistics
Statistics Session 01: Data Layers and Bias in Data
Statistics Session 02: Data Types
Statistics Session 03: Probabilistic Distributions
Statistics Session 04: Probabilistic Distributions
Statistics Session 05: Sampling
Statistics Session 06: Inferential Statistics
Slides
Course Intro
Descriptive Stats
Data Types
Continuous Distributions
Discrete Distributions
Sampling
Hypothesis Testing
SQL
SQL
Session 01: Intro to Relational Databases
Session 02: Intro to PostgreSQL
Session 03: DA with SQL | Data Types & Constraints
Session 04: DA with SQL | Filtering
Session 05: DA with SQL | Numeric Functions
Session 06: DA with SQL | String Functions
Session 07: DA with SQL | Date Functions
Session 08: DA with SQL | JOINs
Session 09: DA with SQL | Advanced SQL
Session 10: DA with SQL | Advanced SQL Functions
Session 11: DA with SQL | UDFs, Stored Procedures
Session 12: DA with SQL | Advanced Aggregations
Session 13: DA with SQL | Final Project
Slides
Intro to Relational Databases
Intro to PostgreSQL
Basic Queries: DDL DLM
Filtering
Numeric Functions
String Functions
Date Functions
Normalization and JOINs
Temporary Tables
Advanced SQL Functions
Reporting and Analysis with SQL
Advanced Aggregations
Python
Python
Session 01: Programming for Data Analysts
Session 02: Python basic Syntax, Data Structures
Session 03: Introduction to Pandas
Session 04: Advanced Pandas
Session 05: Intro to Data Visualization
Session 06: Data Visualization
Session 07: Working with Dates
Session 08: Data Visualization | Plotly
Session 09: Customer Segmentation | RFM
Session 10: A/B Testing
Session 11: Cohort Analysis
Session 12: Simple Linear Regression and Forecasting
Session 13: Logistic Regression
Session 14: Clustering
Session 15: Geoanalytics
Session 16: SQL Alchemy
Slides
Grammar of Graphics
Data Analyst
Tableau
Tableau
Session 01: Introduction to Tableau
Session 02: Intermediate Visual Analytics
Session 03: Advanced Analytics
Session 04: Dashboard Design & Performance
Session 05: Sales Analysis Dashboard
Session 06: Customer Analysis Dashboard
Session 07: Spatial Analytics
Slides
Data Analyst
Data Analyst
Data Analyst
Data Analyst
Python
Python
Session 01: Programming for Data Analysts
Why Programming for Data Analysts?
Before starting the session, first lets try to install and configure the Python.
Session 02: Python basic Syntax, Data Structures
Let revenue be
\(r\)
and tax rate be
\(t\)
.
Session 03: Introduction to Pandas
There are 3 options to unzip the file:
Session 04: Advanced Pandas
In the previous session, we learned how to import
.csv
files into Pandas and perform the first exploratory checks on a dataset. We worked with the structure of a single…
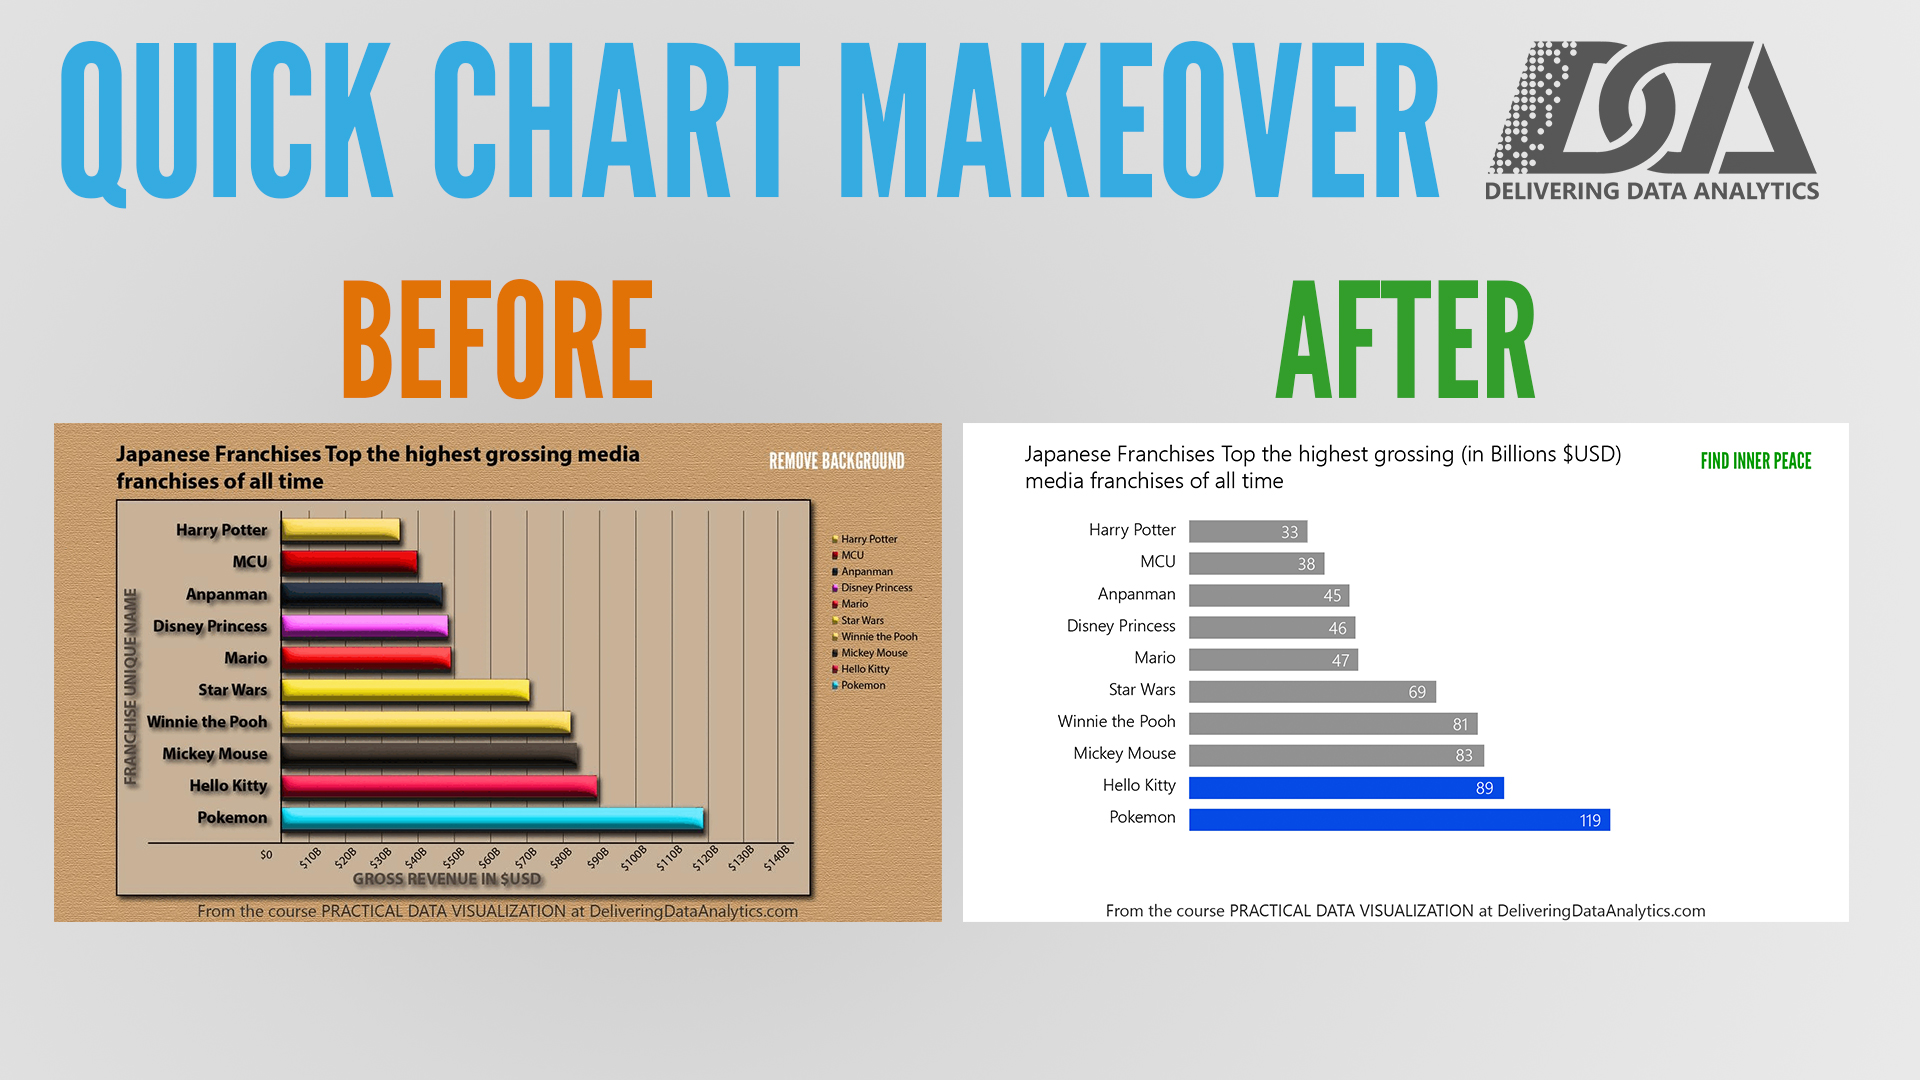
Session 05: Intro to Data Visualization
Data visualization is not only about making charts look attractive. It is about helping the reader understand patterns, comparisons, distributions, relationships, and trends…
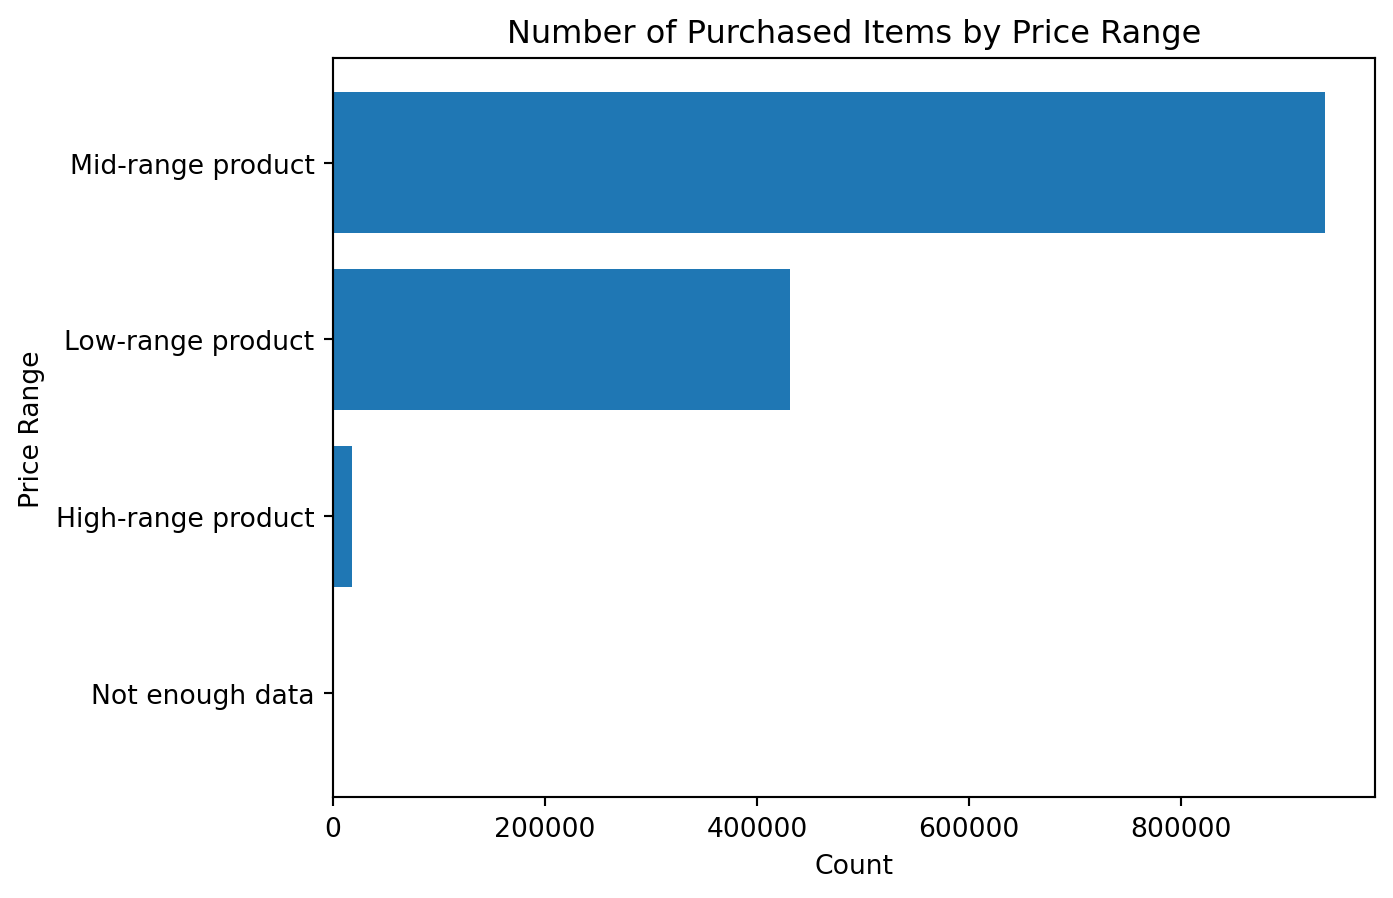
Session 06: Data Visualization
So far, we used
matplotlib
to visualize variables that already existed in the
instacart
DataFrame. However, in real data analytics work, we often need to go one step further.
Session 07: Working with Dates
Before building
time-based
visualizations, we need to become comfortable working with
dates
. In analytics, dates are
everywhere
:
transaction dates
,
signup dates
,
campaign…
Session 08: Data Visualization | Plotly
Plotly is a Python library for creating
interactive visualizations
. It is widely used in analytics, data science, business intelligence, dashboards, and reporting because it…
Session 09: Customer Segmentation | RFM
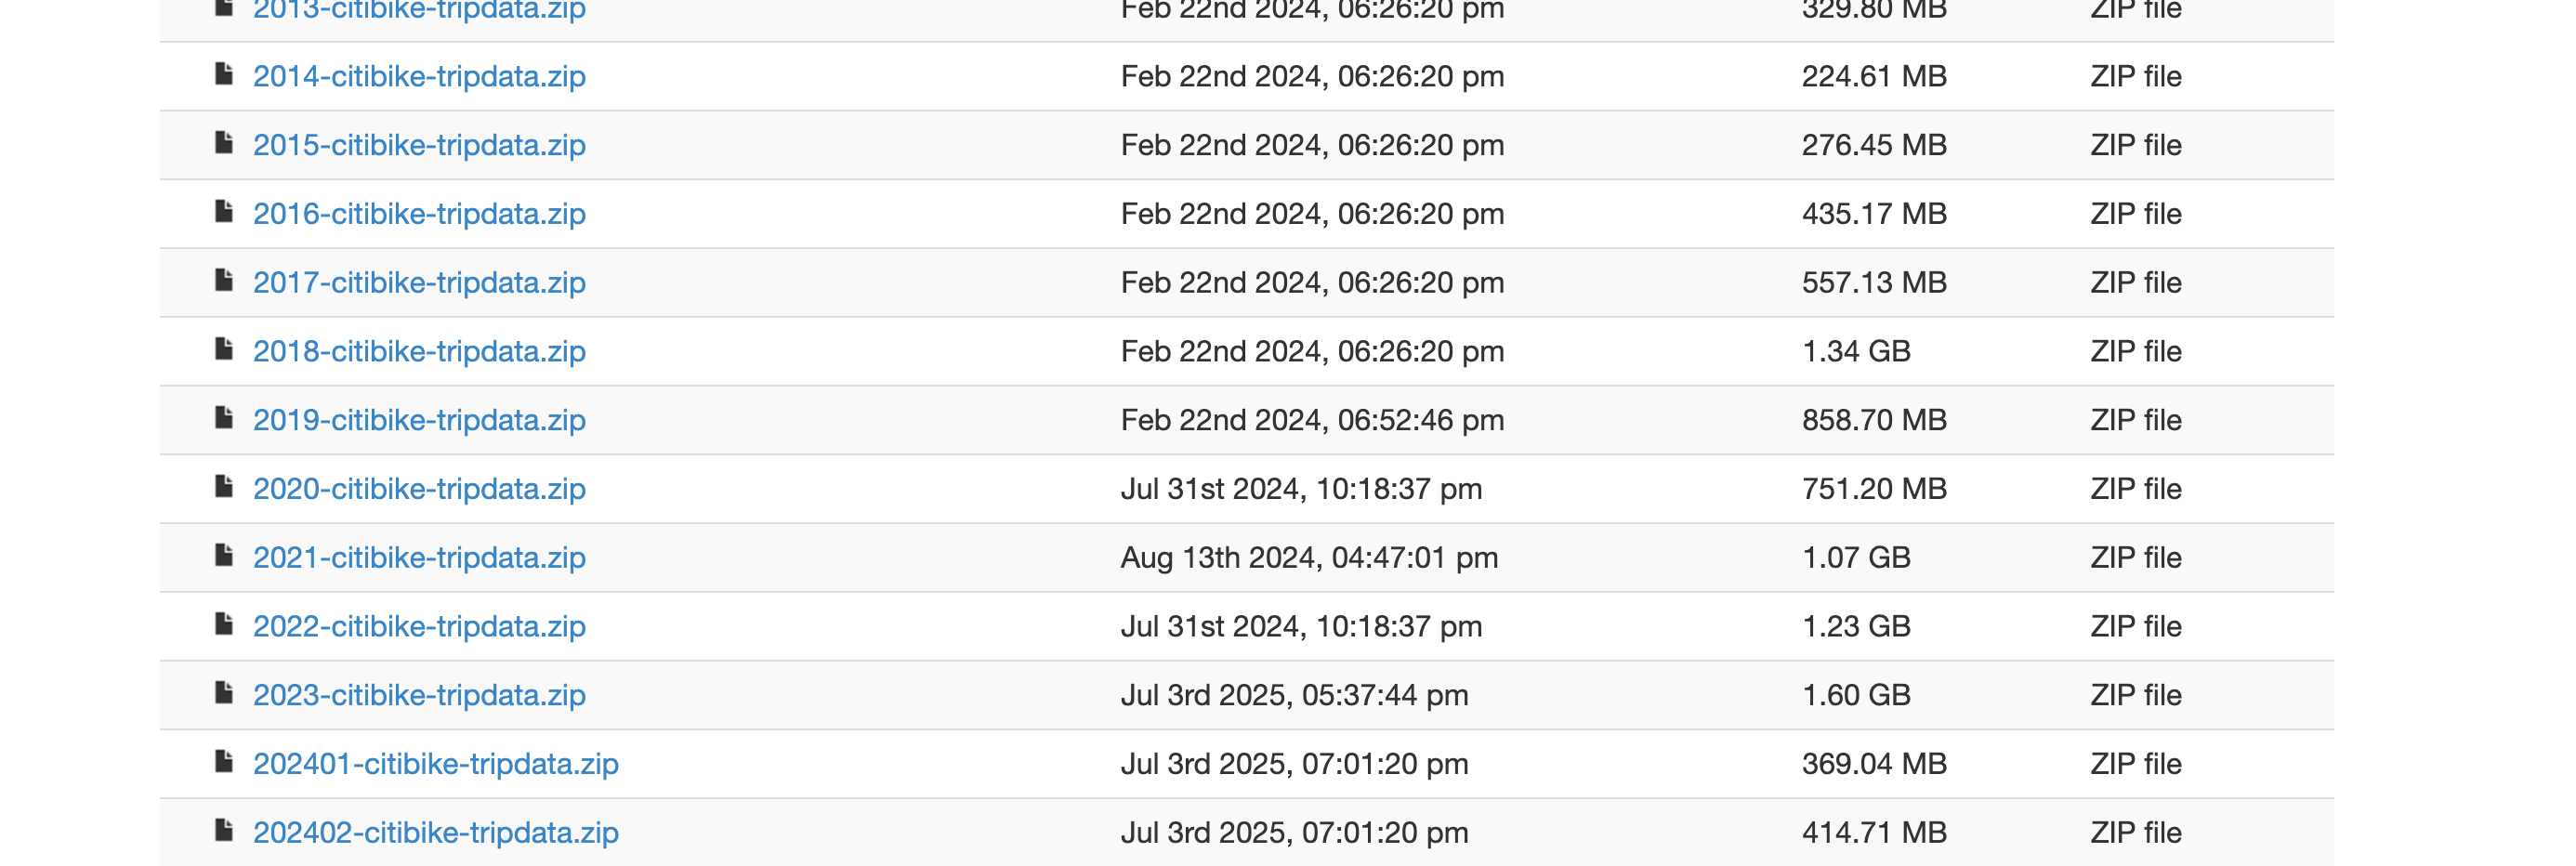
Before starting this exercise first let’s download the data, which you can find here
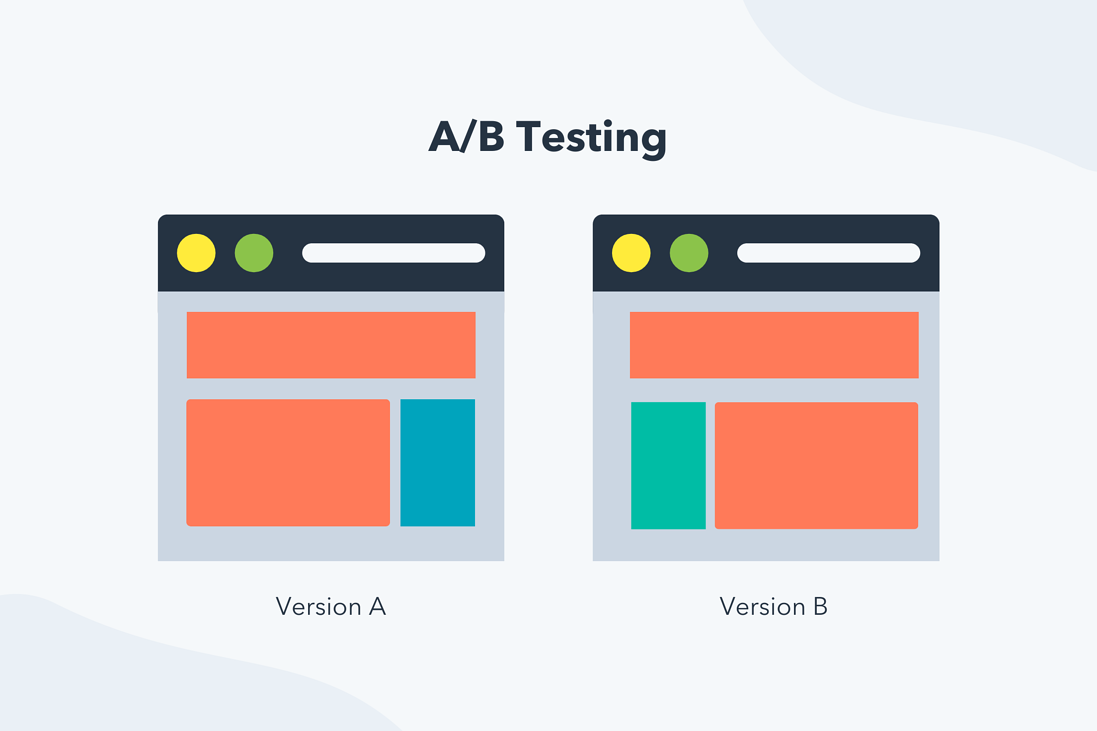
Session 10: A/B Testing
In this session we will cover the following topics:
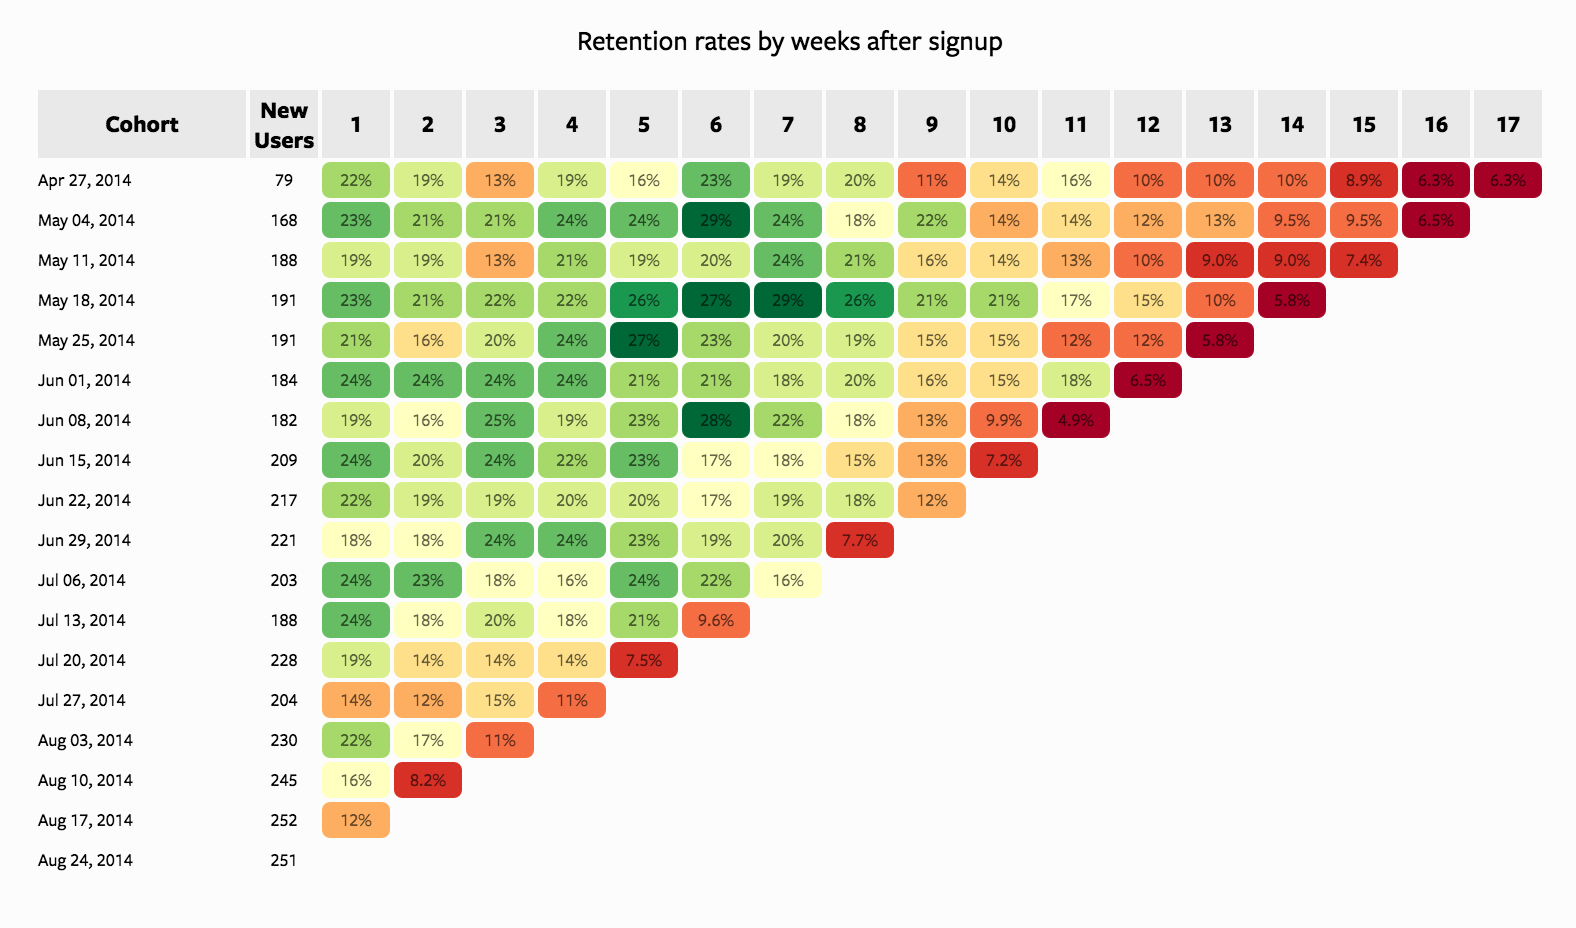
Session 11: Cohort Analysis
Cohort analysis
is a technique where you
group users/customers into cohorts (groups with a shared characteristic)
and track how their behavior evolves over time.
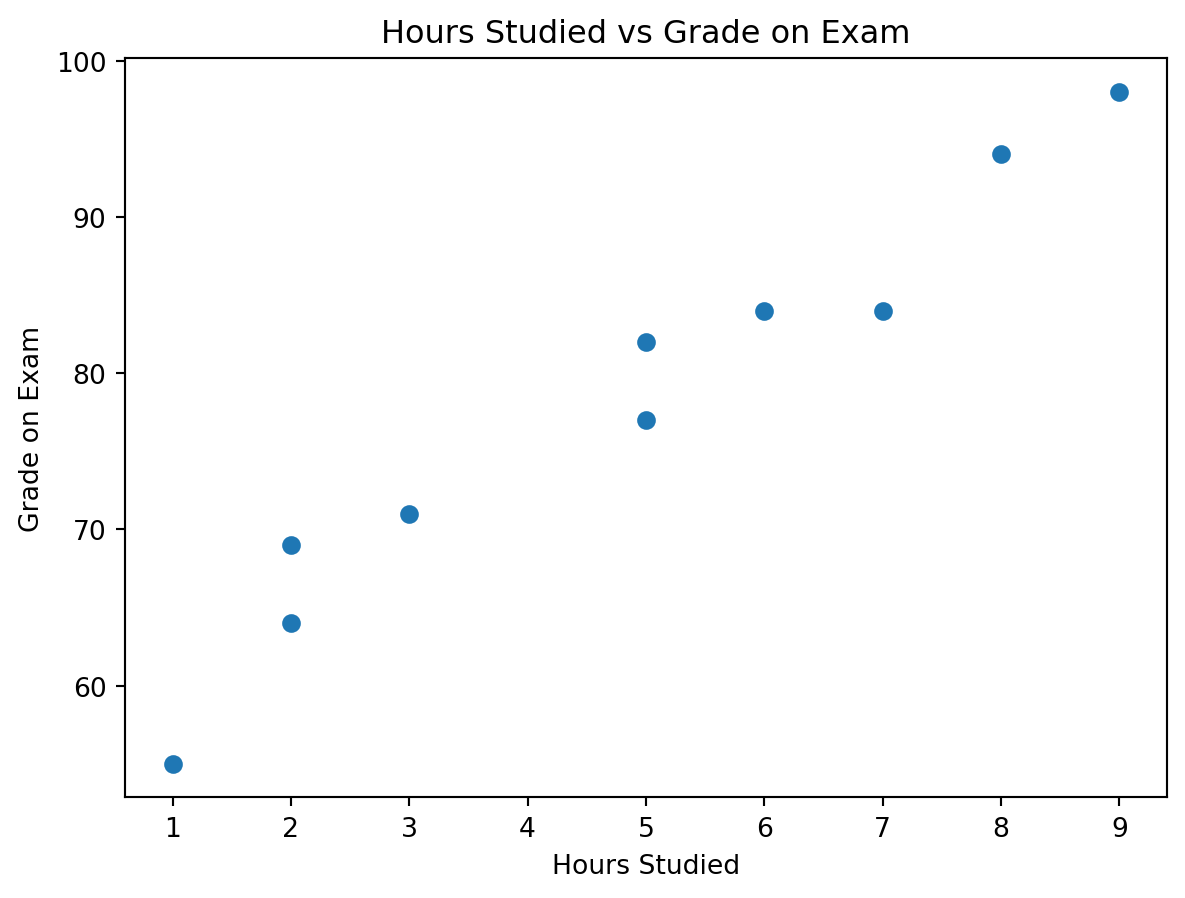
Session 12: Simple Linear Regression and Forecasting
This module introduces one of the most important concepts in data analytics:
understanding relationships and forecasting trends
.
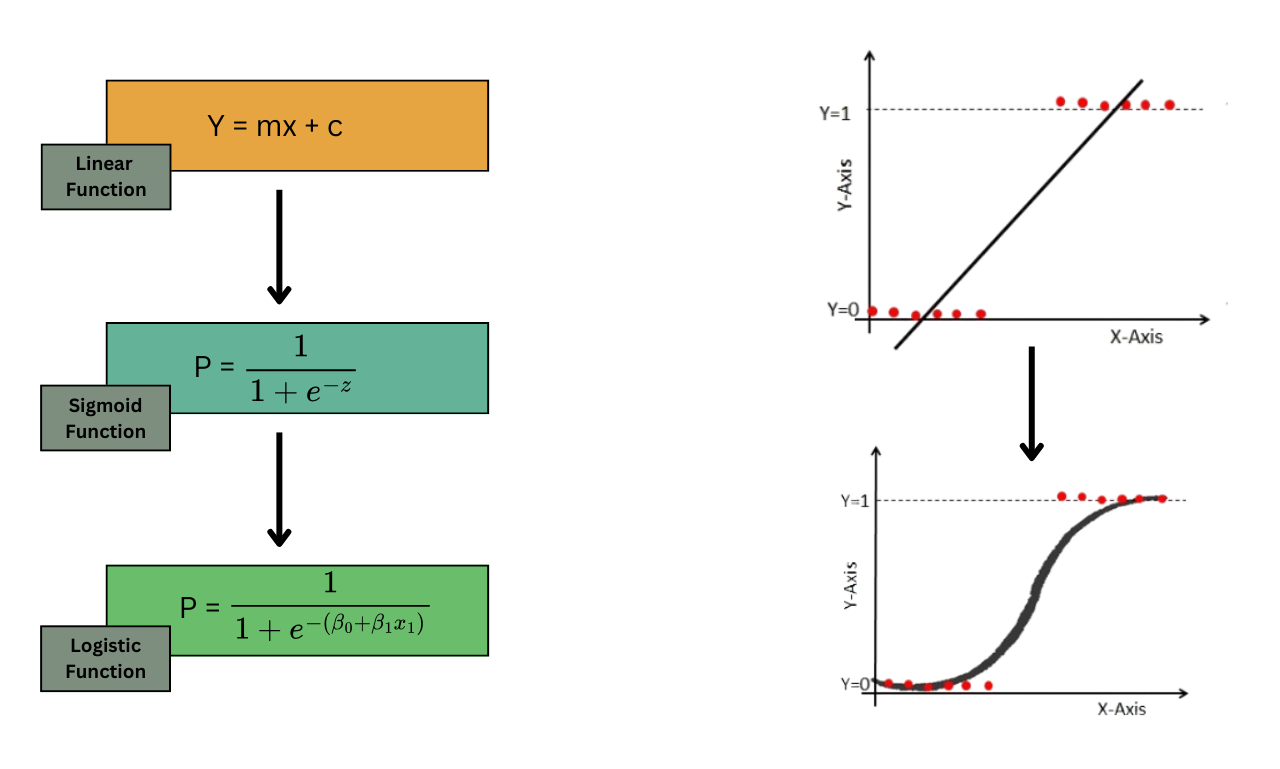
Session 13: Logistic Regression
In this session, we develop a complete understanding of
logistic regression
, starting from intuition and building up to implementation.
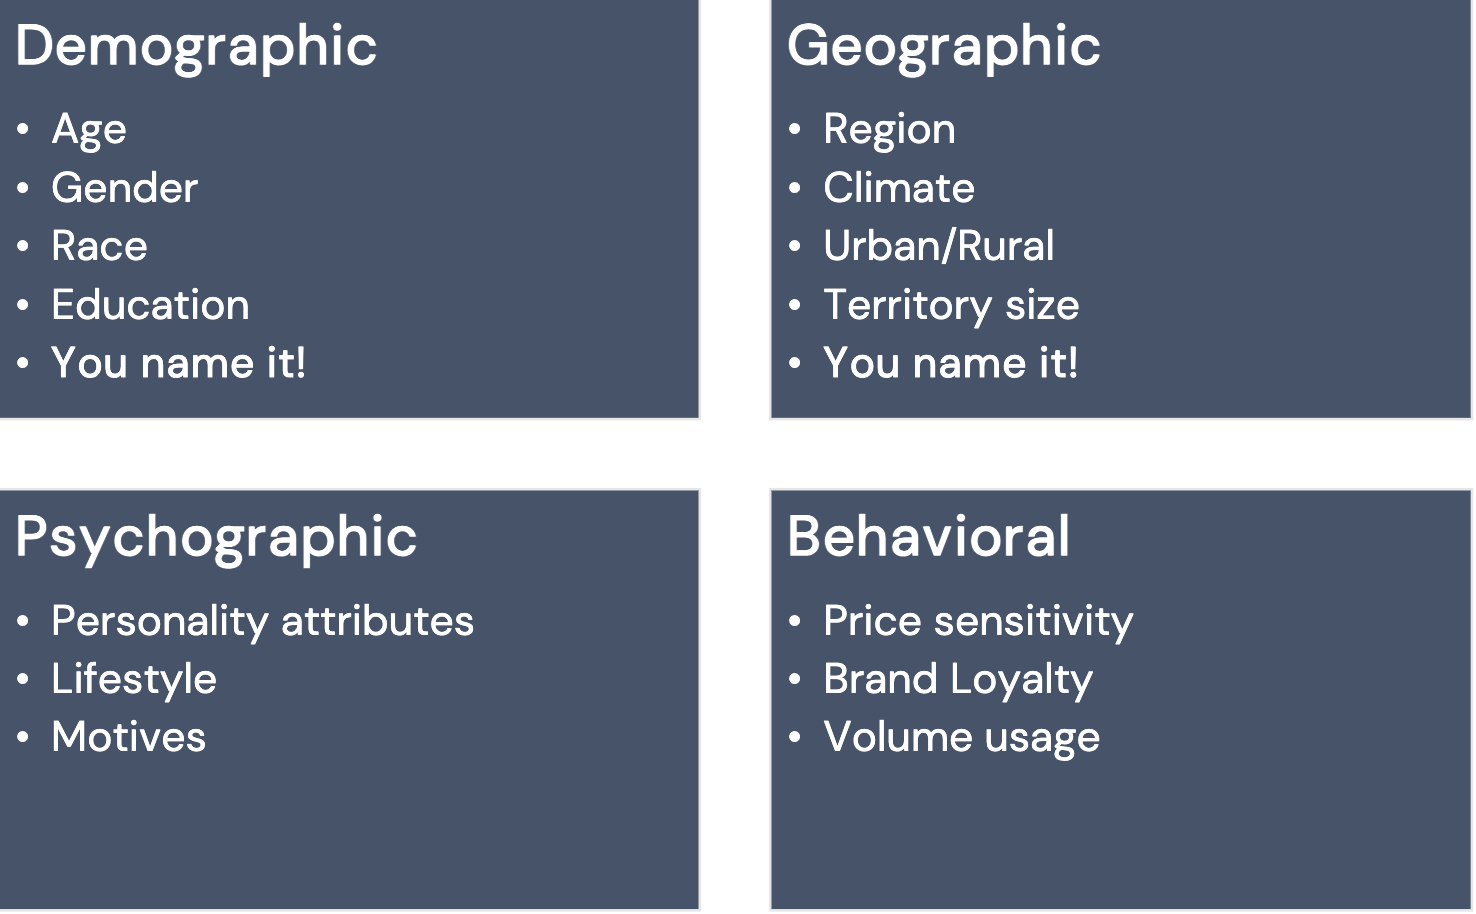
Session 14: Clustering
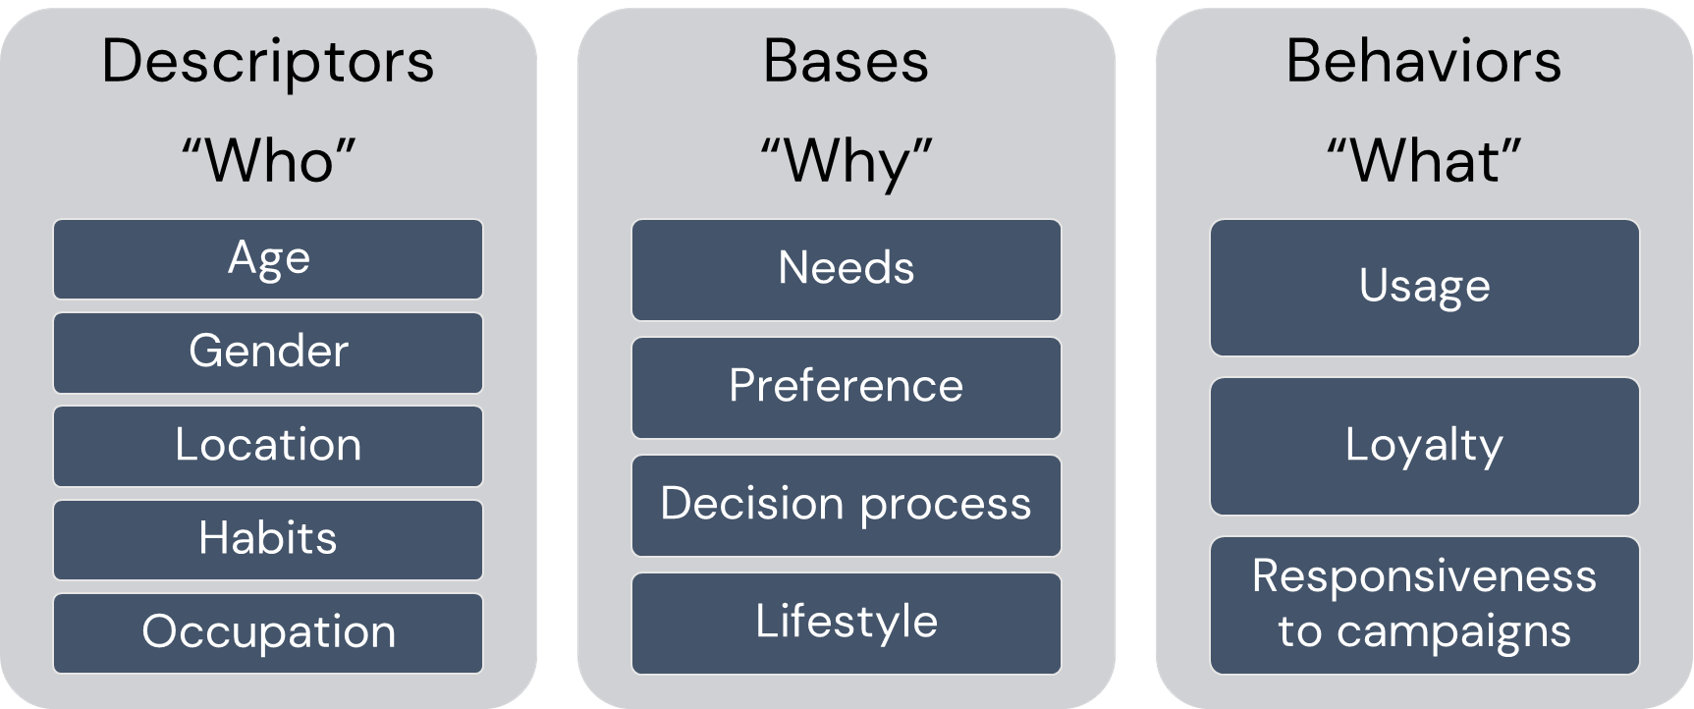
Customer segmentation can be defined as the practice of dividing a customer base into groups of individuals that are similar in specific ways relevant to
Marketing
Session 15: Geoanalytics
In this session, we move from classical data analysis to
geospatial analytics
.
Session 16: SQL Alchemy
No matching items