Course Intro
Onboarding
2026-07-04
Agenda
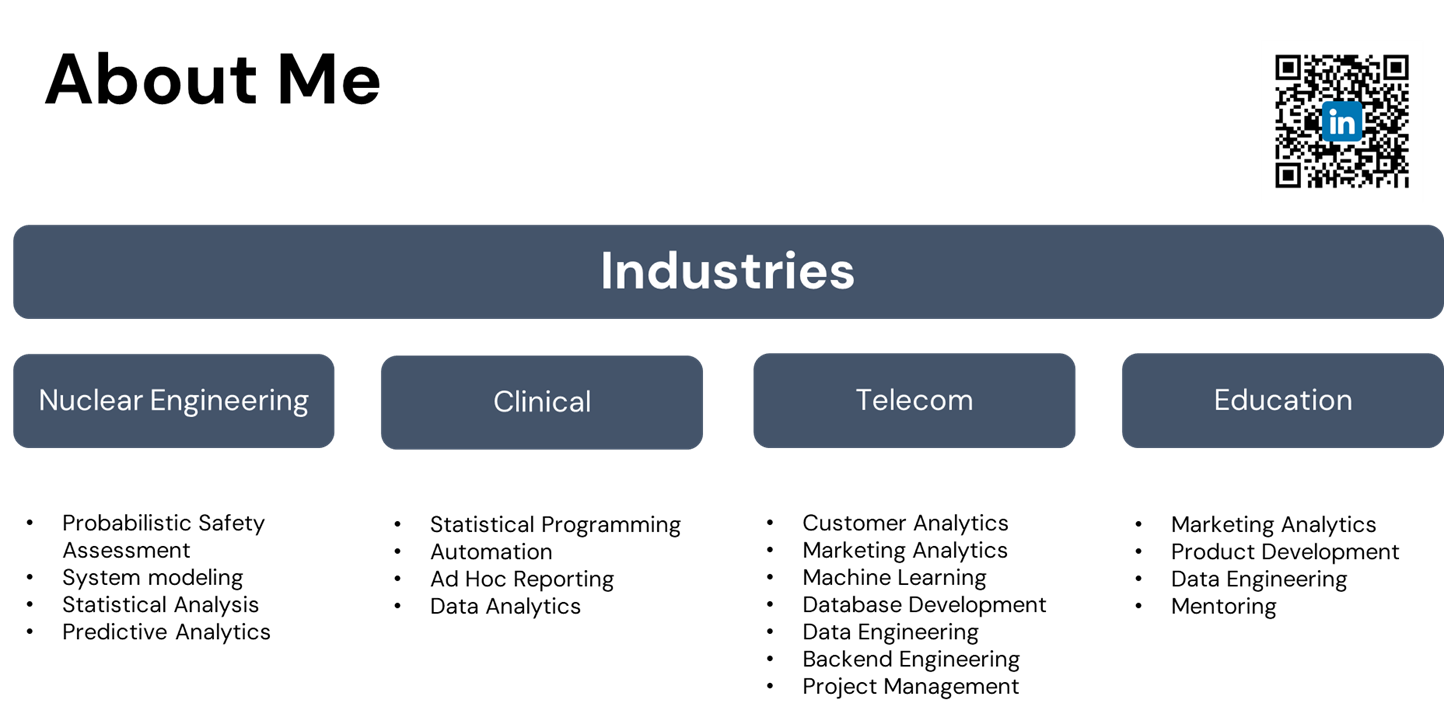
- A little bit about myself
- What is Data Analytics?
- Who is a Data Analyist?
- Program Overview
- Q&A
What is Data Analytics?
… turning data into understanding and action.
<img src=“/img/statistics/00/whatisda.png” height=“600px” style=“float:center; margin-left:700px;”>
Business Questions…
- Why are customers leaving?
- Which products generate the most revenue?
- Which marketing channel performs best?
- Where are operational inefficiencies?
- What drives customer behavior?
Types of Work…
- Cleaning data
- Exploring data
- Visualizing patterns
- Running analyses
- Communicating insights
How Companies Use Analytics
Analytics supports decisions across the entire business:
- Marketing: ROI, segments, attribution
- Sales: funnel, forecasting
- Finance: profitability, risk
- Operations: optimization, efficiency
- Product: customer journeys, A/B tests
Analytics isn’t optional.
It’s how companies stay competitive.
Decision-Making with Analytics
The cycle:
- Define the business problem
- Identify and gather data
- Clean and structure it
- Analyze patterns
- Build dashboards & reports
- Recommend actions
- Monitor results and iterate
Types of Analytics
| Descriptive | Diagnostic | Predictive | Prescriptive | |
|---|---|---|---|---|
| Purpose | Learn what happened. | Learn why something happened. | Learn what is likely to happen. | Learn what to do. |
| Output | Static reports with KPIs. | Reports with drill-down, slicing, and dicing capabilities. | Forecasts. | Actionable recommendations. |
Skills a Data Analyst Needs
- Technical Skills
- Business(soft) Skills
Technical Skills
- SQL
- Python
- Excel
- Statistics
- Visualization tools (Tableau, Power BI)
Business
- Problem formulation
- Interpretation
- Data storytelling
- Communication
About Bootcamp
Instructor: Karen Hovhannisyan
Duration: 6 Months
Modules: 6
Tech Stack: PostgreSQL · Python · Tableau · Docker · Git/GitHub
Tools: VScode · Pgadmin · Terminal · Excel
Goal
Prepare analytical thinkers , not just tool users
Equipping participants with a complete, functional, and standardized analytics environment from coding to version control, databases, and visualization tools.
Learning Journey
Who This Program is For
- Students
- Professionals switching careers
- Analysts wanting to upskill
Module 1 | Statistical Thinking
Outcome: Build a foundational analytical mindset and statistical reasoning before moving to SQL and Python.
- Duration: 4 weeks
- Foundations: descriptive → inferential, sampling, distributions
- Hypotheses, p-values, confidence intervals
- Mini storytelling project
Module 2 | SQL
Outcome: Develop the ability to query, transform, and aggregate data efficiently, creating analytical datasets that form the foundation for Python-based analysis and dashboards.
- Duration: 6 weeks
- Basic queries
- Joins, CTEs, window functions
- Stored procedures, UDFs, CUBE/ROLLUP, materialized views
- Export analytical tables → CSV (for Tableau)
- Mini storytelling project
Module 3 | Python
Outcome: Strengthen analytical programming skills by automating data preparation, performing statistical tests, and applying predictive techniques to extract insights from SQL data.
- Duration: 7 weeks
- Python fundamentals, pandas, visualization
- A/B testing, regression, clustering (high-level)
- SQLAlchemy: read/write with PostgreSQL; ETL
- Mini project
Module 4 | Tableau
Outcome: Learn to visualize, interpret, and communicate insights effectively through interactive and dynamic dashboards that transform analytical results into compelling business narratives.
- Duration: 5 weeks
- Visual analytics, LODs, interactivity
- Design principles & performance
- Build public dashboards (Tableau Public)
Module 5 | Capstone
Integrate all acquired skills to design and deliver a complete end-to-end analytics project. From raw data to visual storytelling,demonstrating readiness for real-world analytics roles.
- Duration: 3 weeks
- Full pipeline: Problem Definition → SQL → Python → Tableau
- GitHub repo + Tableau Public link
- Portfolio
- Final presentation
Connected the dots
Module 1 — Statistical Thinking: Build a foundational analytical mindset and statistical reasoning before moving to SQL and Python.
Module 2 — SQL: Develop the ability to query, transform, and aggregate data efficiently, creating analytical datasets that form the foundation for Python-based analysis and dashboards.
Module 3 — Python: Strengthen analytical programming skills by automating data preparation, performing statistical tests, and applying predictive techniques to extract insights from SQL data.
Module 4 — Tableau: Learn to visualize, interpret, and communicate insights effectively through interactive and dynamic dashboards that transform analytical results into compelling business narratives.
Module 5 — Capstone: Integrate all acquired skills to design and deliver a complete end-to-end analytics project—from raw data to visual storytelling—demonstrating readiness for real-world analytics roles.
Course Logistics
Lecture Notes
All the course materials you can find here
The material includes:
- Slides
- Extended Reading
- Homework
- Program installation and setup