flowchart LR
    A[Capture / Collection] --> B[Storage / Management]
    B --> C[Processing / Transformation]
    C --> D[Analysis / Modeling]
    D --> E[Communication / Decision]

    classDef stage fill:#f4f4f4,stroke:#555,stroke-width:1px,color:#000,font-weight:bold;
    class A,B,C,D,E stage;

    subgraph Roles [Key Roles]
        DE[Data Engineer]
        AE[Analytics Engineer]
        DA[Data Analyst]
        DS[Data Scientist]
        BM[Business Manager]
    end

    DE -. supports .-> A
    DE -. builds pipelines .-> B
    AE -. transforms data .-> C
    DA -. explores data .-> D
    DS -. models data .-> D
    BM -. acts on insight .-> E

    style Roles fill:#f9f9f9,stroke:#ccc,stroke-width:1px,color:#333;
Descriptive Stats
Statistical Thinking
Karen Hovhannisyan
2026-07-04
Overview
This module introduces the foundations of data analytics and statistical thinking.
Students explore how data becomes insight, what types of analytics exist, and how organizations move through the data lifecycle—from collection to decision-making.
By the end of the class, you should be able to describe what data analytics is, recognize the main forms of analytics, and identify how data-related roles interact within a company.
What Is Data Analytics?
Data analytics is the practice of examining data systematically to discover useful information, reach conclusions, and support decision-making.
In practice, it bridges raw data and business strategy.
- Data Generation – transactions, sensors, user interactions, or surveys produce raw data.
- Collection and Storage – data is gathered and kept in databases, data warehouses, or cloud systems.
- Processing and Integration – data is cleaned, formatted, and connected across sources.
- Analysis and Modeling – statistical or machine-learning methods reveal patterns and predict outcomes.
- Communication and Action – visualizations, dashboards, and reports communicate insights for business decisions.
Important
This data-to-insight flow is iterative; every analysis generates new questions that feed the next cycle.
Business Applications of Data Analytics
Analytics supports decision-making across many domains:
- Telecommunications: predicting churn, optimizing network performance, or tailoring offers.
- Retail: analyzing baskets, forecasting demand, or optimizing pricing.
- Finance: assessing credit risk or detecting fraud.
- Marketing: evaluating campaign effectiveness and designing experiments (A/B tests).
- Healthcare: identifying risk factors or optimizing treatment outcomes.
The unifying theme is that analytics translates data into value by informing actions.
Types of Analytics
Different analytical approaches answer different questions.
| Type | Central Question | Typical Methods | Example |
|---|---|---|---|
| Descriptive | What happened? | Aggregation, visualization | Monthly sales by region |
| Diagnostic | Why did it happen? | Correlation, segmentation | Analyzing the effect of pricing on sales |
| Predictive | What might happen? | Regression, classification, forecasting | Predicting churn probability |
| Prescriptive | What should we do? | Optimization, simulation | Recommending personalized offers |
Explanation with Lego
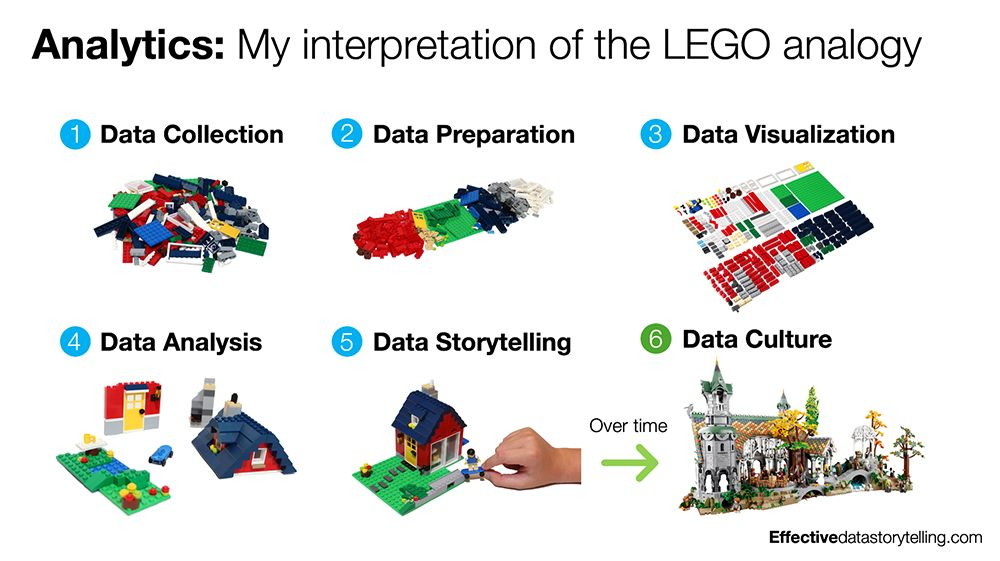
The Data Lifecycle
The data lifecycle describes how information moves through an organization and is transformed into insight.
- Capture / Collection: raw data is obtained from transactional systems, sensors, APIs, or external datasets.
- Storage / Management: engineers design and maintain databases, warehouses, or data lakes to store data efficiently and securely.
- Processing / Transformation: data is cleaned, structured, and enriched to prepare it for analysis.
- Analysis / Modeling: analytical teams explore data, test hypotheses, and build models that explain or predict outcomes.
- Communication / Decision: results are shared through dashboards, visualizations, and reports to support business actions.
Professional Roles
| Role | Primary Responsibilities |
|---|---|
| Data Engineer | Builds and maintains the data infrastructure, pipelines, and integrations that collect and store raw data. |
| Analytics Engineer | Bridges engineering and analysis by transforming raw data into clean, documented, and reusable datasets—often using SQL, dbt, and data-modeling best practices. Ensures analysts and data scientists can work efficiently with trustworthy, well-structured data. |
| Data Analyst | Explores datasets, performs aggregations, builds dashboards, and answers business questions through descriptive and diagnostic analysis. |
| Business Analyst | The business analyst plays a similar role to the data analyst while bringing domain-specific knowledge to their work. A financial analyst, for example, is a type of business analyst who specializes in working with data from the finance industry. |
| Data Scientist | Applies statistical and machine-learning techniques to uncover patterns, generate predictions, and perform experimentation. |
| Business Stakeholder / Manager | Interprets and acts on insights, ensuring that data-driven decisions translate into measurable outcomes. |
Flow
Types of data used commonly
Definition of data
Definition
Data is used in its broadest sense: observations, measurements and facts (both quantitative and qualitative) that serve as information or evidence.
Zero-party data
Data intentionally or proactively shared by audiences, such as:
- Responses to polls, surveys or quizzes
- Profiling details added to online accounts or loyalty programmes
First-party data
Proprietary data collected directly (with consent) via a company’s own channels:
- Digital interactions (website, apps)
- Customer Relationship Management (CRM) systems
- Content engagement
- Point-of-sale systems
- Transactions (accounting systems)
- Interactions with digital support and call centres
First-party data | Examples
Examples of first-party data products:
- Sales performance metrics by region/country/category
- CRM extracts: contact info, purchase and interaction history for segmentation/personalization
- Loyalty/payment card purchase data showing behavioural patterns
- Email marketing metrics: open rate, click-through rate, subscriber behaviour
Second-party data
Data not collected by the business itself but associated with its customers/audiences and obtained via a partnership or contractual agreement.
Examples:
- Retail purchase data
- Market research and survey data
- Channel partner/supplier data treated as first-party within that relationship
Typical second-party sources in business:
- In-store shopper research
- Panels/retail share data (e.g., Kantar/Nielsen/IRI/Mintel)
- Brand and communications tracking studies; ad testing; in-depth interviews
- Web scraping (owned sites) and forums for sentiment, reviews, and competitive intelligence
Third-party data
Trusted third-party examples:
- Social platforms’ aggregated audience and behaviour insights
- External website analytics (e.g., Google Analytics) offering traffic, conversion, and interaction insights
- Vendors (e.g., Experian/Acxiom/Dun & Bradstreet) providing profiles, segmentation, and targeting datasets
- Open/public data (e.g., census aggregates)
About Regulations
Data collected by another entity that doesn’t have a direct link to your customers/audiences, often aggregated and licensed for use. The privacy regulations like GDPR have tightened access and usage.
Definition of insight
An actionable insight connects observations to what matters and what to do next:
- What? — the observations from the data
- Why? — why it matters
- So what? — relevance and relative importance
- Now what? — the recommended action
Definition of insight | What? Why? So what? Now what?
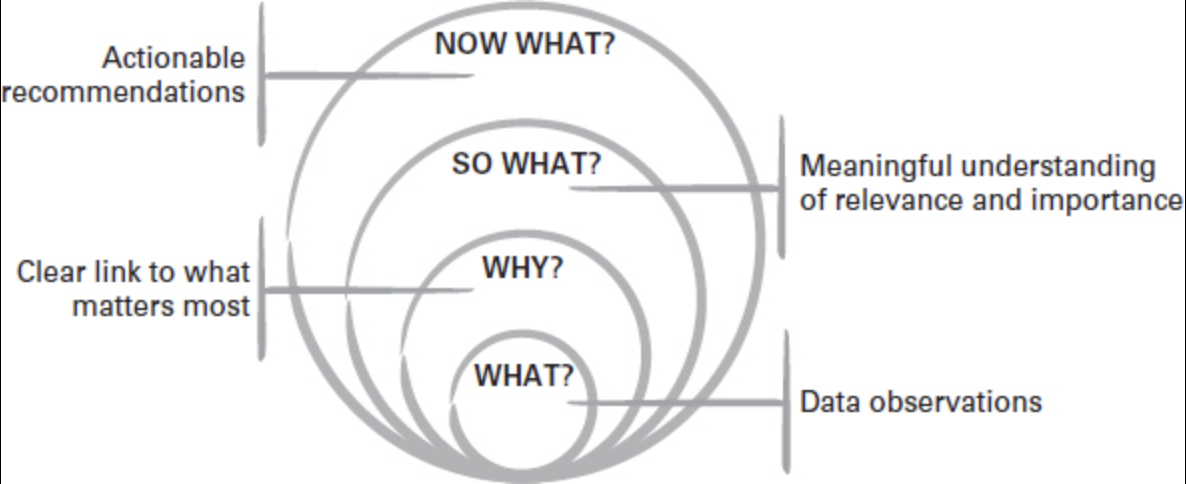
Key reminders:
- A data point isn’t useful unless it links to why it matters.
- It isn’t insightful unless it answers so what (why it’s relevant/important).
- It isn’t actionable unless it leads to a feasible now what recommendation.
Reporting vs Storytelling
Reporting
Reporting is the systematic process of turning raw data into structured, interpretable information that supports monitoring, decision-making, and accountability.
It focuses on consistency, repeatability, and standardization.
Reporting in practice:
- Collecting data from one or more sources
- Transforming and aggregating data using agreed business rules
- Presenting outputs in standardized formats such as dashboards, tables, PDFs, or spreadsheets
Keyword
The key word in reporting is standardized.
Storytelling
Storytelling is a communication practice that uses narrative structure to help audiences understand, interpret, and act.
Data storytelling applies storytelling techniques to communicate:
- Insights
- Implications
- Recommended actions
It goes beyond raw data by adding context, judgment, and meaning.
Visualization supports storytelling, but visualization alone is not a story.
Reporting vs Storytelling
| Dimension | Data Reporting | Data Storytelling |
|---|---|---|
| Primary focus | Communicates the data | Communicates the insight and action |
| Approach | Standardized and repeatable | Customized to audience and situation |
| Audience effort | Requires data literacy | Reduces cognitive load for the audience |
| Core skills | Data accuracy and visualization | Critical thinking and communication |
| Typical output | Dashboards, reports, KPIs | Narratives, recommendations, decisions |
Single Source of Truth (SSOT)
A Single Source of Truth (SSOT) is a practice where one authoritative data source is defined for each metric or domain.
All reports, dashboards, and analyses rely on this source.
In simple terms:
One question → one correct answer
Why SSOT matters:
- Consistency across reports
- Trust in numbers
- Reduced duplicated logic
- Faster, more confident decision-making
- Clear governance and ownership
Video
Bias in Data
Types of Bias in Data
Understanding bias is crucial in data analytics, as it affects the reliability and fairness of insights and models.
As junior data analysts, it’s easy to fall into the trap of believing that data is objective, that it represents raw truth, and that it cannot be misinterpreted.
Where Bias Comes From
Data is produced either by humans or by machines and algorithms created by humans.
\[\Downarrow\]
Data inevitably reflects human assumptions, choices, and limitations.
Bias can therefore lead to poor decisions or false beliefs if left unchecked.
Data Ethics and Bias
One of the core principles of data ethics is transparency in how data is:
- Collected
- Sampled
- Processed
- Interpreted
Remember
Bias awareness does not eliminate all issues, but it significantly reduces analytical risk.
Data Coverage & Inclusion Biases
Biases at this stage affect representation.
If present, all downstream analysis is structurally compromised.
Selection Biases:
- Sampling
- Exclusion
- Survivorship
Selection Bias | 1/1
Happens when certain groups are systematically excluded or included due to how data is selected.
Example:
A marketing campaign’s success is evaluated only on customers who opened emails, ignoring those who didn’t → engagement appears artificially high.
How to Avoid?
- Randomize inclusion criteria; avoid convenience filtering (e.g., “openers only”).
- Compare included vs. excluded groups; use propensity scores or re-weighting.
- Expand recruitment channels and reduce barriers to inclusion.
Selection Bias | 2/2
.
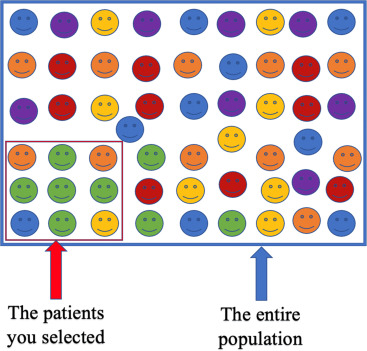
Sampling Bias | 1/2
Occurs when the data collected is not representative of the entire population.
Example:
A telecom company predicts churn using data only from urban customers, ignoring rural ones.
The model will likely perform poorly for rural areas.
How to Avoid?
- Define the target population explicitly and sample across all key segments.
- Use probability sampling where possible; otherwise weight to population benchmarks.
- Monitor sample composition continuously and correct drift.
Sampling Bias | 2/2
.
Survivorship Bias | 1/2
Focusing only on successful cases while ignoring failures.
Example:
Analyzing only successful marketing campaigns inflates perceived effectiveness.
How to Avoid?
- Track full cohorts, including churned, inactive, or failed cases.
- Report denominators and attrition explicitly.
- Avoid filtering by “survived” outcomes in exploratory analysis.
Survivorship Bias | 2/2

.
Exclusion Bias
Important variables are mistakenly left out during data collection or preprocessing.
Example:
An e-commerce model excludes device_type (mobile vs. desktop), missing behavior differences that affect conversion.
How to Avoid?
- Map requirements with domain experts; maintain a
"must-have"variable inventory.
- Trace feature lineage; run ablation tests to detect missing signal.
- Iterate collection forms and ETL to capture omitted fields.
Exclusion Bias

.
Data Collection & Measurement Biases
Biases at this stage affect how data is recorded and reported.
Even with correct population coverage, poor measurement distorts reality.
Measurement Bias
Arises from inaccurate tools or methods used to collect data.
Example:
A survey app records 0 when users skip a question instead of missing, misleading analysts.
How to Avoid?
- Standardize definitions and validation rules; treat missing explicitly.
- Calibrate and test instruments; run overlap periods when switching tools.
- Include automated data-quality checks in ETL.
Recall Bias
Occurs when participants don’t accurately remember past events.
Example:
Respondents under or over report store visits over the past month.
How to Avoid?
- Shorten recall windows.
- Use diaries or passive behavioral data where possible.
- Ask concrete, bounded questions.
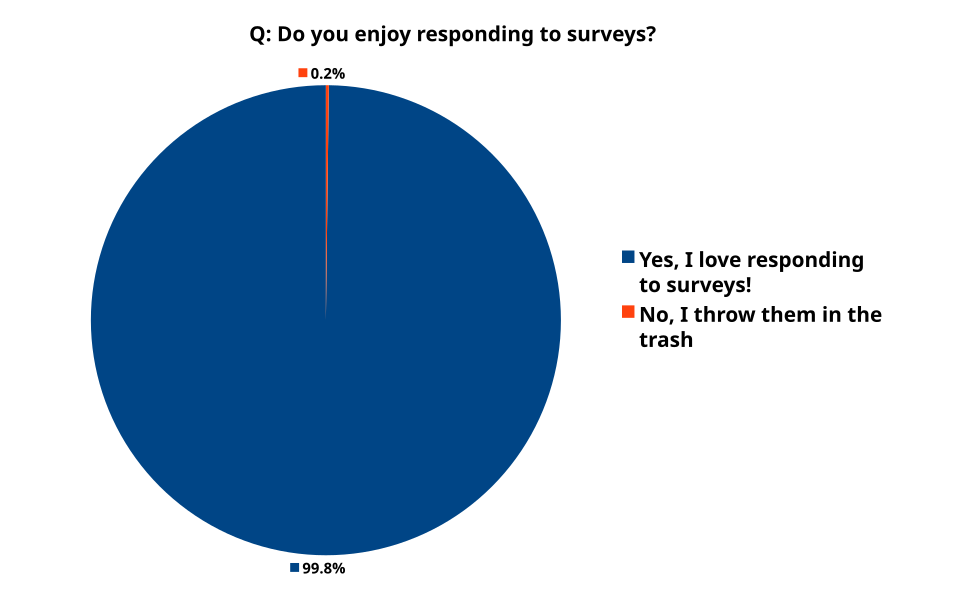
Response Bias
Participants give socially desirable or expected answers rather than truthful ones.
Example:
Customers rate satisfaction higher to appear polite.
How to Avoid?
- Use neutral wording and anonymity.
- Prefer behavioral measures over self-reports.
- Include validity checks such as reverse-coded items.
Observer Bias
A researcher’s expectations influence data collection or interpretation.
Example:
An analyst expecting a new ad to perform well emphasizes positive feedback.
How to Avoid?
- Blind analysts to treatment where feasible.
- Use objective scoring rubrics and inter-rater reliability checks.
- Automate extraction or labeling where appropriate.
Analysis & Modeling Biases
Biases at this stage affect interpretation, reasoning, and model learning.
They often amplify earlier data issues.
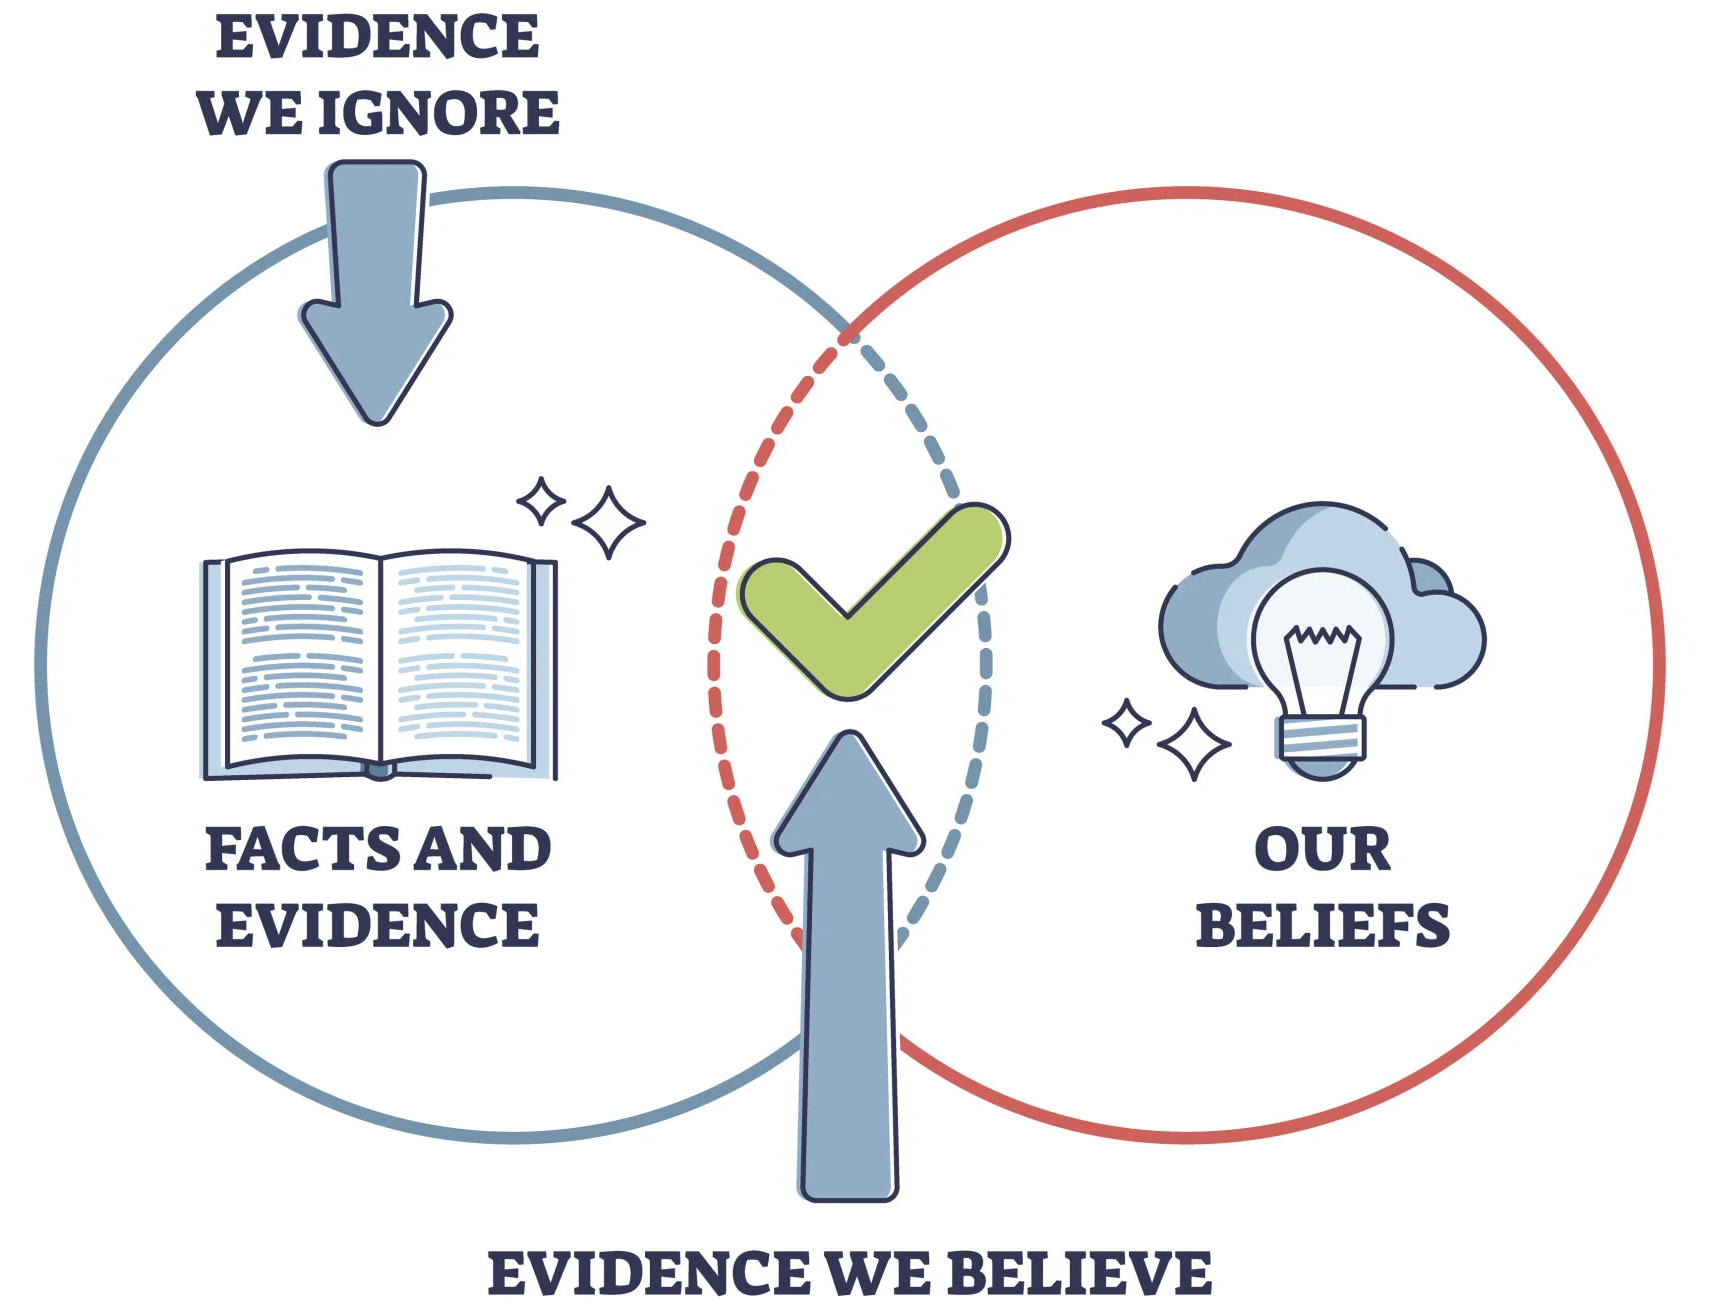
Confirmation Bias | 1/2
Tendency to favor data that confirms existing beliefs.
Example:
Analyzing only high-discount months to prove discounts improve retention.
How to Avoid?
- Define research questions and success criteria upfront.
- Seek disconfirming evidence.
- Use holdout periods and peer review.
Confirmation Bias | 2/2
.
Availability Bias
Recent or vivid events are over-weighted in judgment.
Example:
Overestimating plane crash risk after extensive media coverage.
How to Avoid?
- Use base rates and long-term averages.
- Place events in historical context.
Historical Bias
Outdated or biased historical data perpetuates inequalities.
Example:
A credit model trained on biased historical lending decisions disadvantages certain groups.
How to Avoid?
- Audit legacy datasets for representation and proxies.
- Refresh training data and apply time-aware validation.
- Monitor subgroup performance.
Algorithmic Bias
Algorithms learn or amplify biased patterns from data.
Example:
A hiring model trained on biased past decisions favors male applicants.
How to Avoid?
- Remove or regularize proxy features.
- Evaluate subgroup metrics and fairness constraints.
- Retrain using de-biased data or post-processing techniques.
Reporting & Communication Biases
Biases at this stage affect how insights are presented and interpreted.
Reporting Bias
Selective presentation of results that favor a narrative.
Example:
Highlighting CTR improvements while hiding declining customer satisfaction.
How to Avoid?
- Predefine reporting bundles with guardrail metrics.
- Show uncertainty and denominators.
- Publish full results or appendices.
Bias Summary
| Bias Type | Key Cause | Example Context |
|---|---|---|
| Selection Bias | Non-random inclusion | Only counting email openers |
| Sampling Bias | Non-representative sample | Urban-only churn model |
| Survivorship Bias | Ignoring failures | Studying only successful campaigns |
| Exclusion Bias | Missing variables | Omitting device type |
| Measurement Bias | Faulty data recording | 0 instead of missing |
| Recall Bias | Memory errors | Self-reported visits |
| Response Bias | Social desirability | Inflated satisfaction |
| Observer Bias | Researcher expectations | Selective feedback |
| Confirmation Bias | Favoring expected results | Ignoring non-discount data |
| Availability Bias | Recency effects | Overestimating rare risks |
| Historical Bias | Biased legacy data | Credit discrimination |
| Algorithmic Bias | Model amplification | Gender bias in hiring |
| Reporting Bias | Selective reporting | Hidden negative KPIs |
Preview of Next Class
The next chapter introduces Descriptive Statistics and Introductory Visualization.